Pi Coin Price Hangs Between Two Signals — Which Wins?

Pi Coin has held stronger than most major cryptocurrencies as the crypto market corrected by over 3% today. While Bitcoin, Ethereum, and BNB dropped between 3% and 12%, the Pi Coin price slipped only 1.5% in the past 24 hours — showing rare resilience. Yet traders are now facing a puzzle: two opposing chart signals that could determine whether the next move brings recovery or another leg down.
For now, Pi Coin’s structure is caught between cautious optimism and fading strength.
Sponsored
Sponsored

Two Signals, One Uncertain Outcome
Pi Coin’s chart presents an interesting clash between buying strength and momentum weakness — two signals that usually guide short-term price direction.
The Money Flow Index (MFI), which tracks money flowing in and out of the asset, has been climbing even as the Pi Coin price made a lower low between August 1 and October 9. This is typically seen as a bullish divergence, suggesting that while prices fell, fresh buying quietly entered the market. It reflects growing retail interest — the kind of slow accumulation that often forms the base for a rebound.
Want more token insights like this? Sign up for Editor Harsh Notariya’s Daily Crypto Newsletter here.
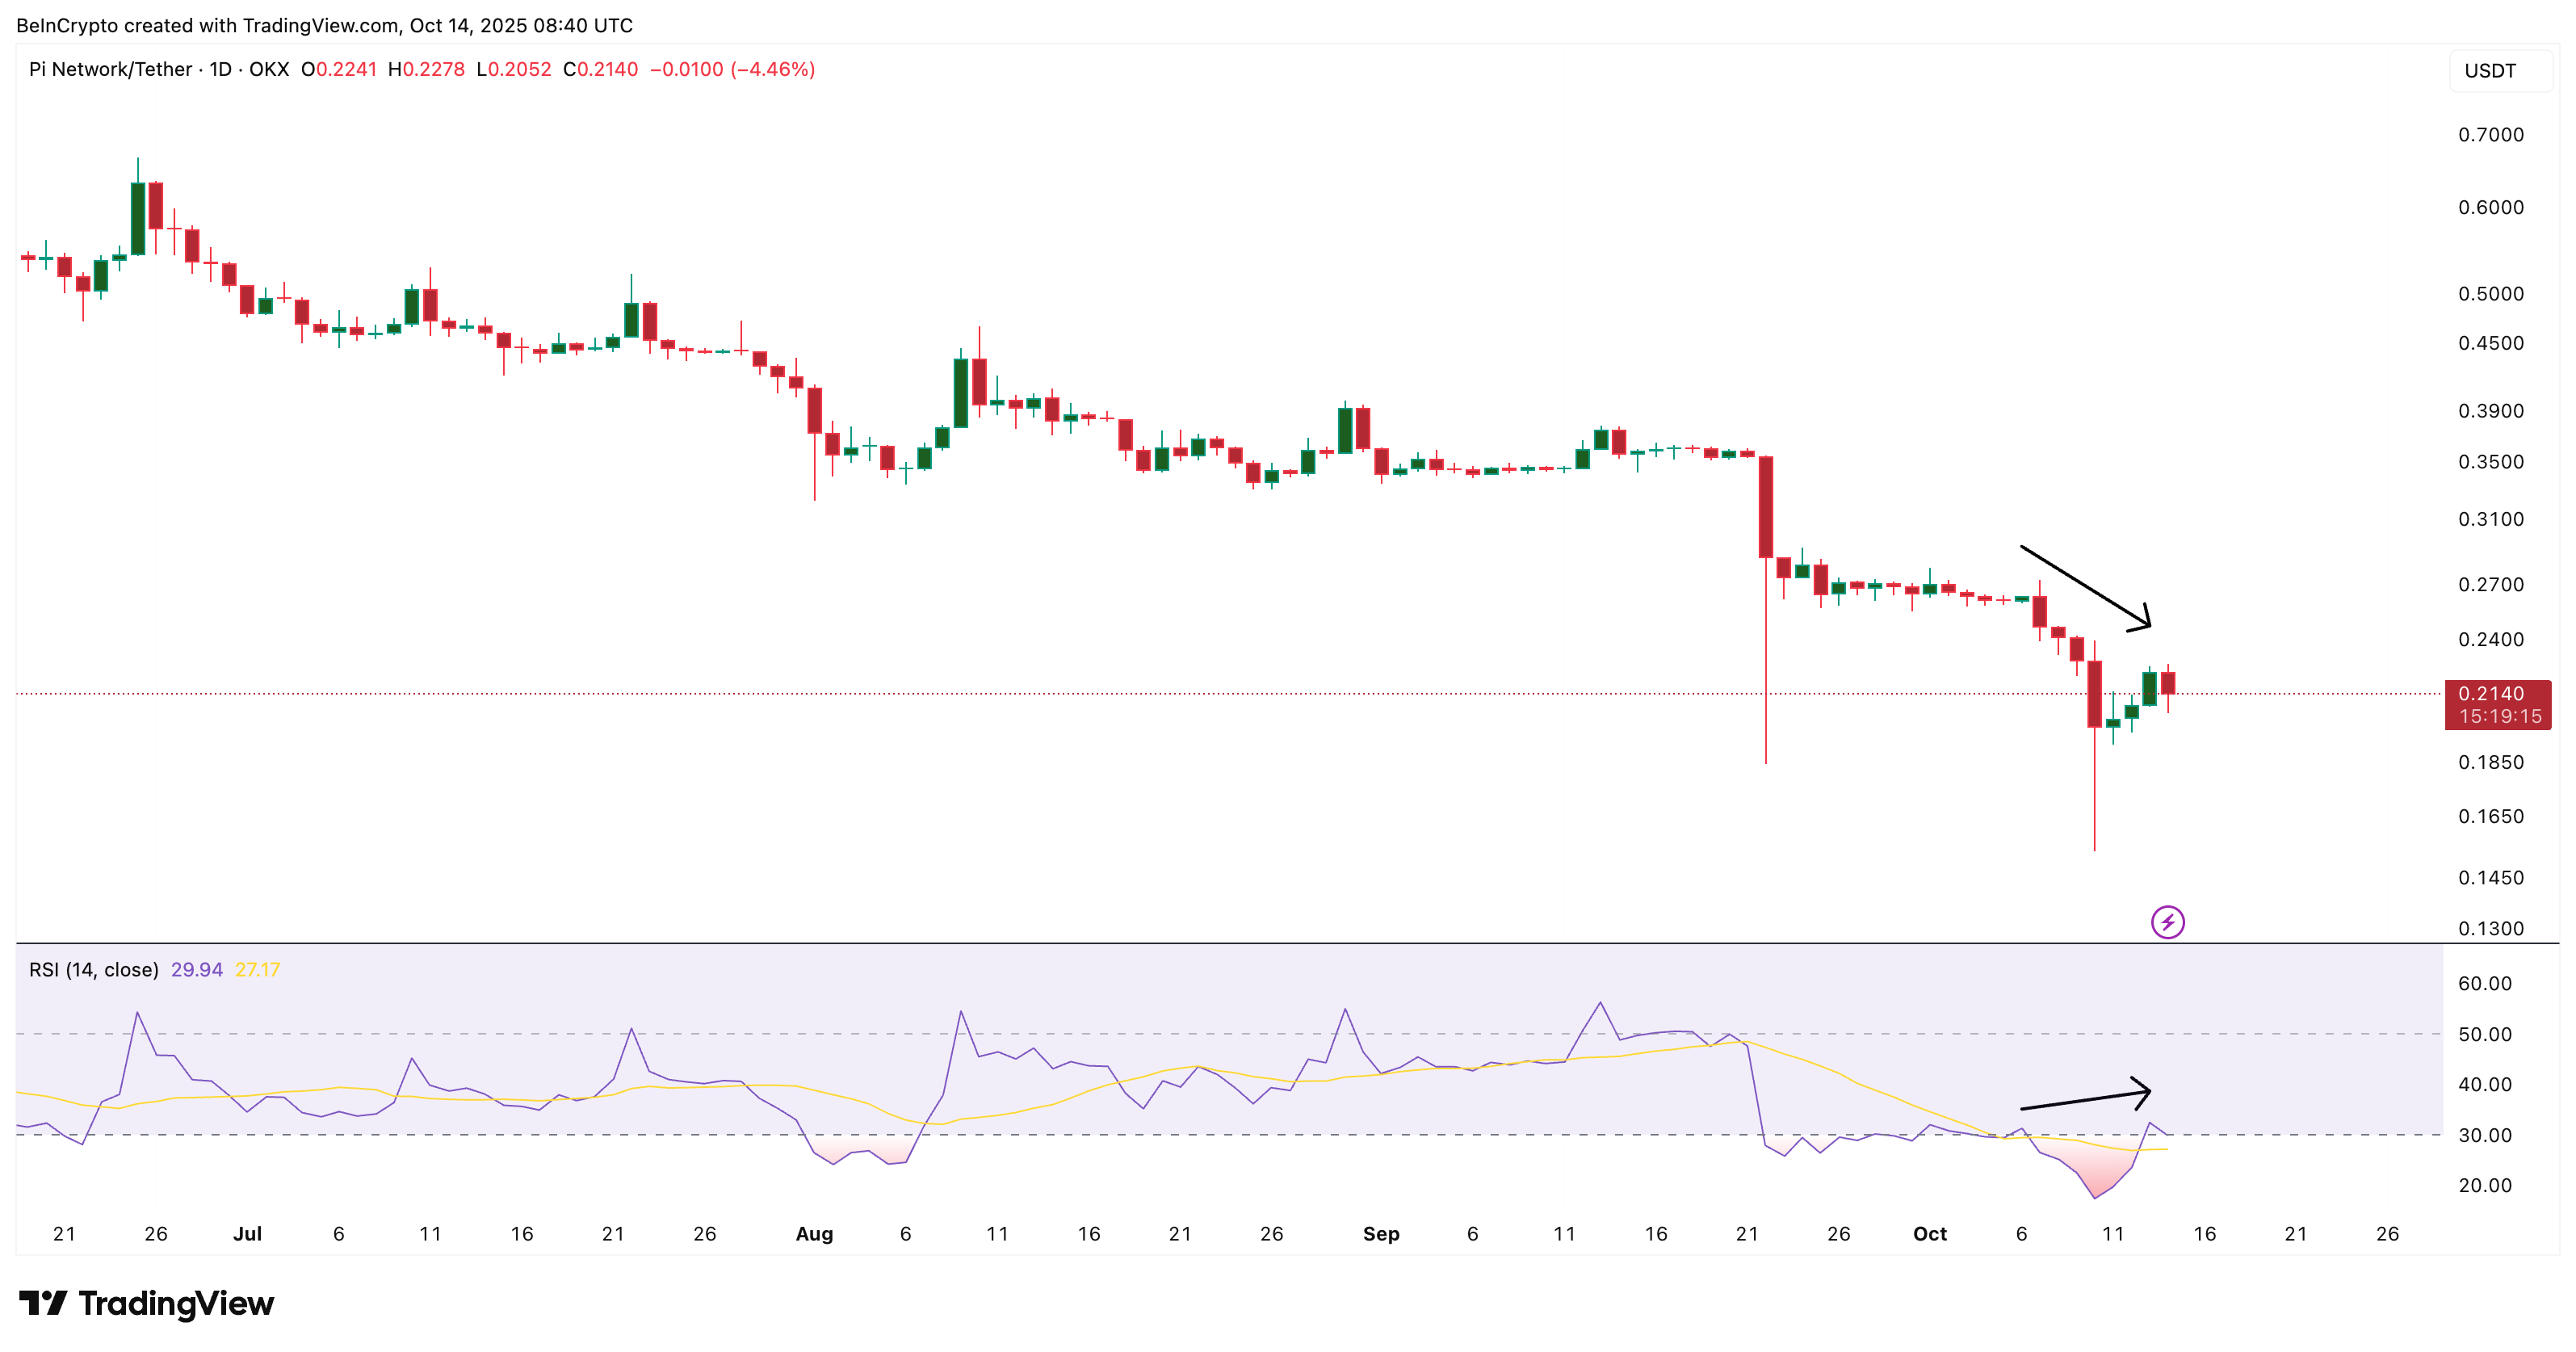
However, between October 6 and October 13, PI’s Relative Strength Index (RSI) — a measure of market momentum — painted a hidden bearish divergence. Prices made a lower high while RSI made a higher high, indicating that buying momentum is fading even as short-term recovery attempts occur.
Sponsored
Sponsored
Rather than contradicting each other completely, these two readings could be showing different stages of the same process: MFI points to early accumulation, while RSI warns that recovery may face resistance before stronger confirmation. For traders, that means the setup still leans neutral — with a slight tilt toward caution until the next breakout or breakdown confirms direction.
More on this in the next section, where we discuss the Pi Coin price action.
Pi Coin Price Setup Reveals A Falling Wedge
From a structural perspective, the Pi Coin price trades inside a falling wedge — a pattern that often hints at a possible bullish reversal on a daily chart.
To confirm strength, a daily Pi Coin price candle must move above $0.29, which would indicate a breakout from the wedge and likely attract new buying volume.
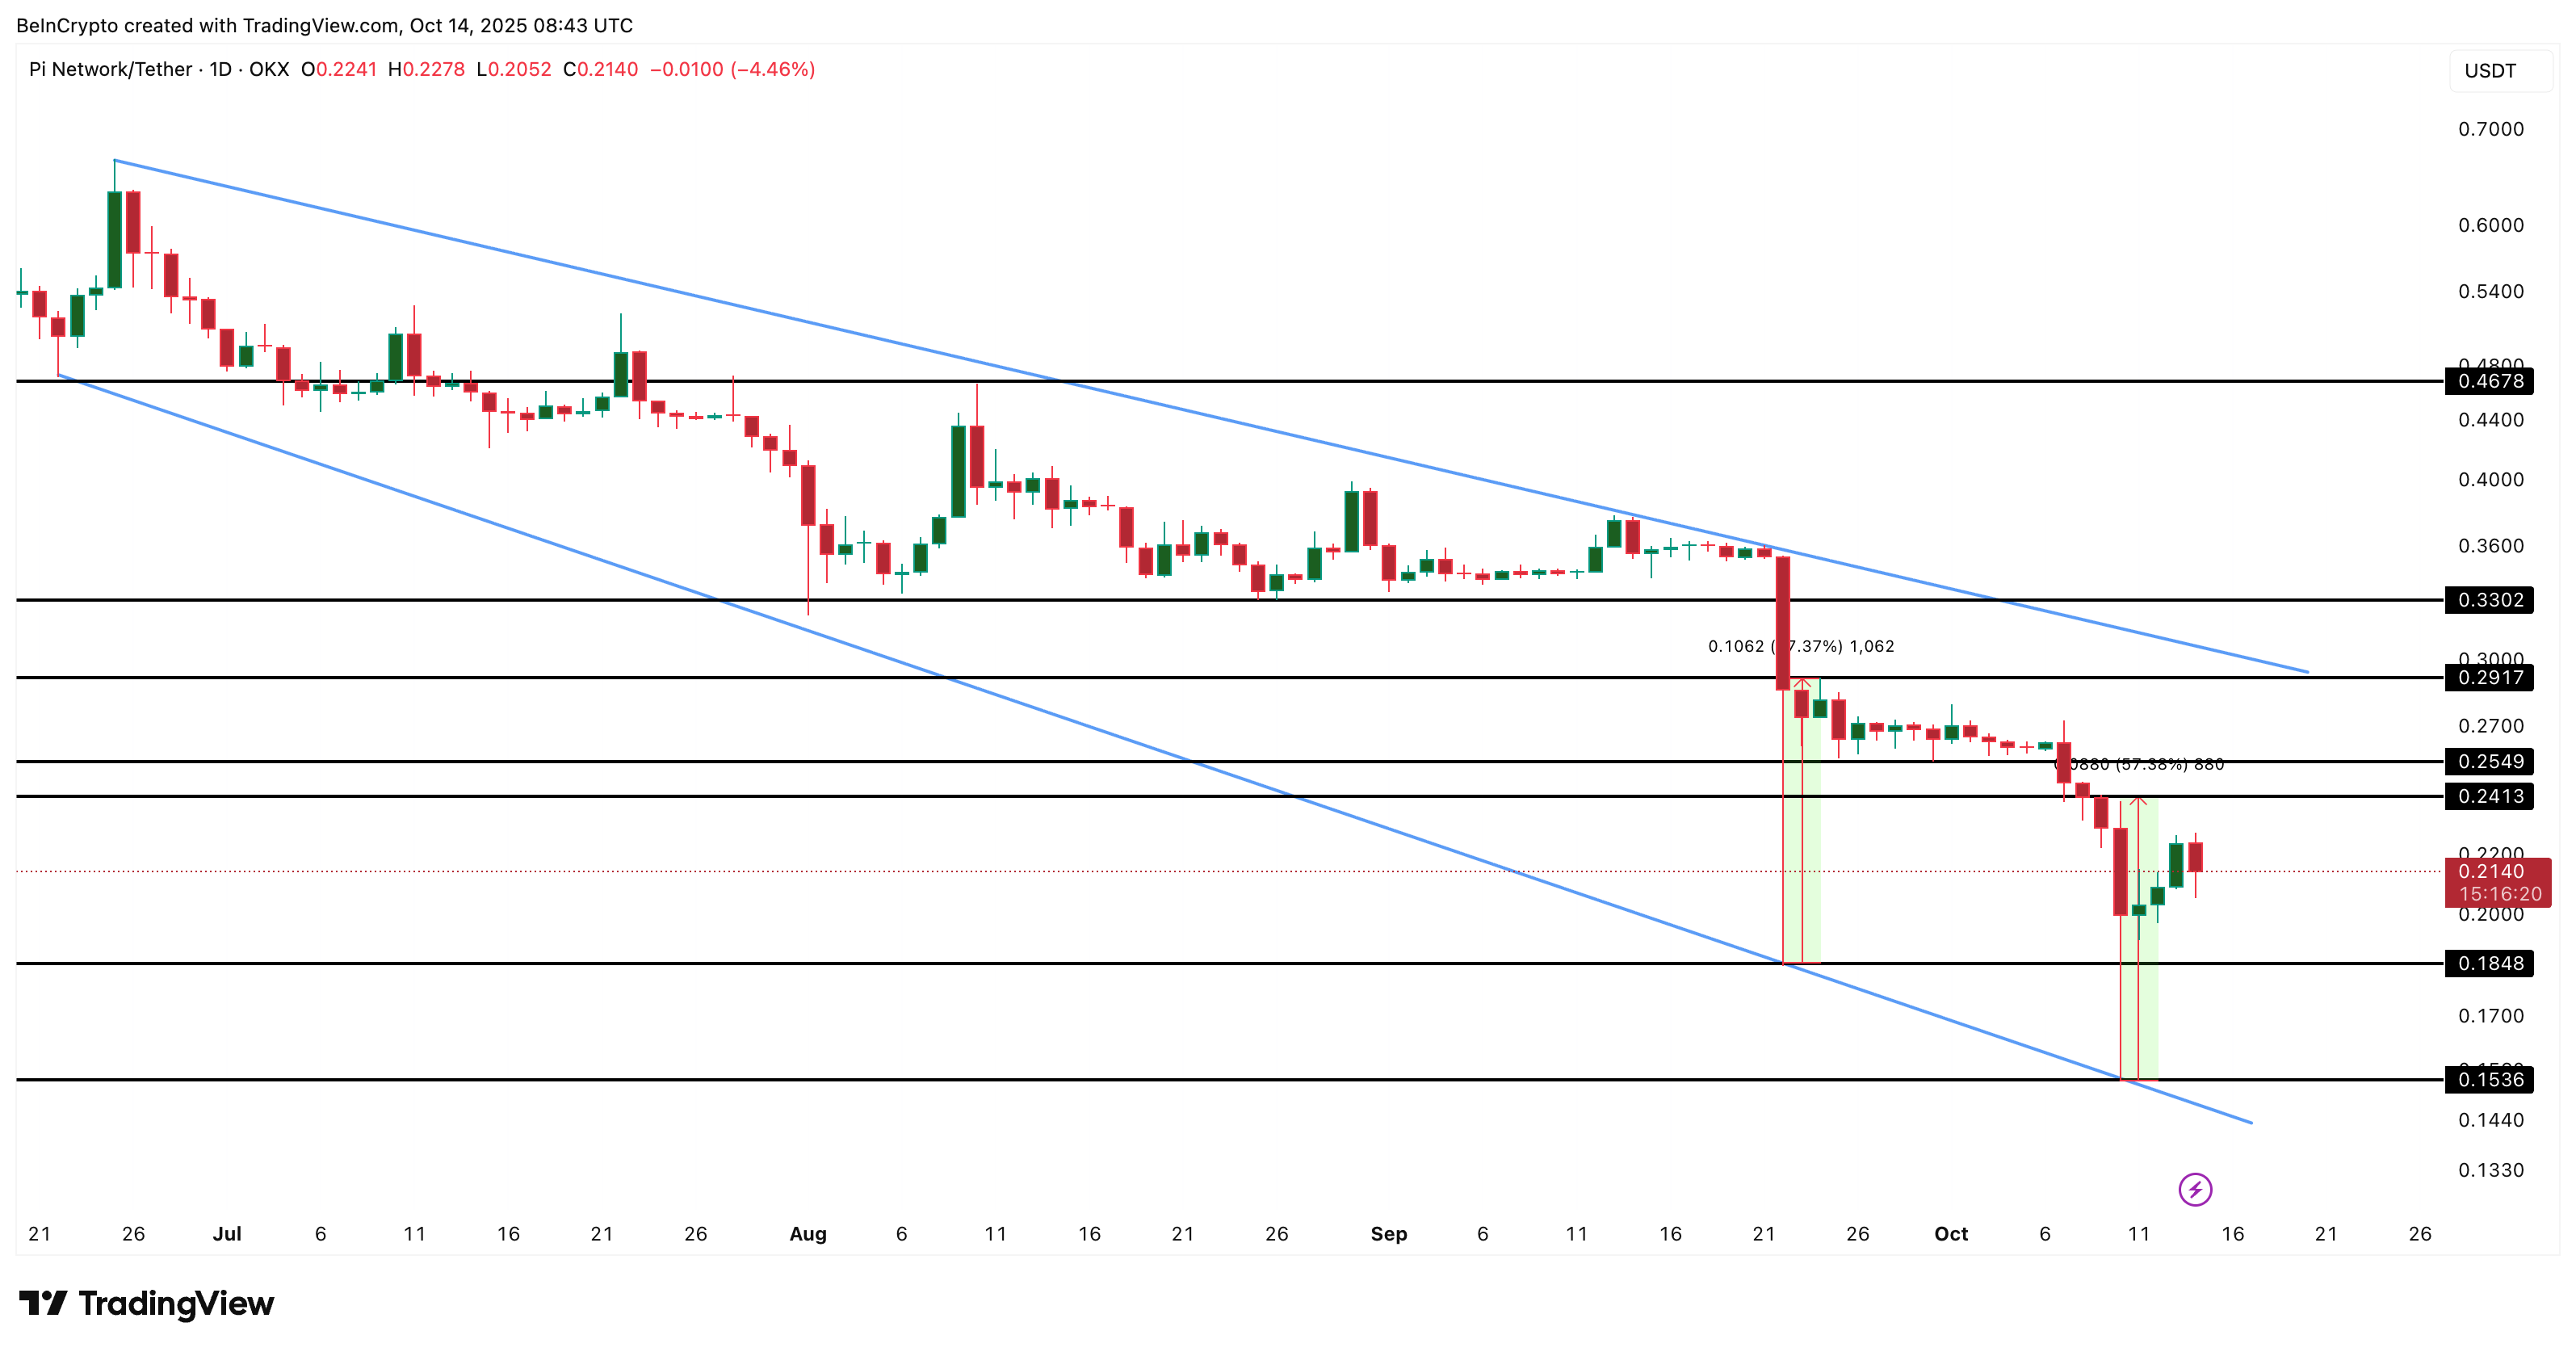
However, if we just look at the near-term history, a rebound similar to September 22, when PI jumped 57% from $0.18 to $0.29, could repeat. This implies short-term targets around $0.24–$0.25, with an extended move toward $0.29 possible if momentum picks up. And breaking $0.29 cleanly would mean bullish strength for the Pi Coin price.
At the time of writing, Pi Coin (PI) trades near $0.21, with strong support around $0.18 and $0.15. A clean daily close below $0.15 would break the wedge to the downside, invalidating the bullish setup.
For now, PI remains one of the few coins outperforming the market but still walking a fine line. Whether the MFI-led accumulation wins or RSI-led weakness extends the pullback, the falling wedge will be the final judge of where the Pi Coin price goes next.